Products & Modules

Durable, robust, high-performance – and combinable

Each component fulfils a clearly defined task and runs on Windows and Linux alike. Together they form an end-to-end architecture from raw reading to report – individually they also complement existing system landscapes.

Data Storage

The data core

The foundation of every toposoft solution: the time series database at the centre, flanked by the master data and geo databases.

Centre

TopoDB

Time series database

  • High-performance storage of time-related mass data – hundreds of thousands of readings per second
  • Fine-grained attribution: origin, unit, measuring method and more per value
  • Raw data retained permanently, editing levels (qualities) in parallel
  • Faster than InfluxDB in our benchmarks, on par with QuestDB
  • Flanked by a master data database (stations etc.) and a geo database (maps & layers)

TopoServer

From network drive to network protocol

  • SQL-capable time series management system
  • Reliable communication between Windows clients and Linux servers
  • Foundation for multi-user operation
Screenshot: TopoServer status overview

TopoRast & grid data

Grid time series database

  • Managing and analysing radar data and other grids
  • Derive time series directly from areal precipitation
  • Multi-parameter grids (e.g. ensemble data)
Screenshot: radar data analysis with TopoRast
Access

Open to your tools

SQL, REST, command line or browser – you decide how to access your data.

New

TopoFlix

The flexible interface: SQL · REST · CLI

  • SQL queries across the time series, master data and geo databases
  • REST interface for data ingestion from your own systems
  • Command-line interface for scripting and automation
  • Connect your own applications, Python scripts and BI tools with no proprietary client lock-in

Example: finding time series

SELECT zrid,ort,parameter FROM ser_catalog WHERE Ort="3001005"

+--------------------------------+---------+-------------+
| ZRID                           | ORT     | PARAMETER   |
+--------------------------------+---------+-------------+
| ser_tvrb7d6hoyx6yhtorng372jfkq | 3001005 | Abfluss     |
| ser_f6stmzqzc6ouwl7n5mlg4v7ffe | 3001005 | Wasserstand |
+--------------------------------+---------+-------------+

Same call via REST – result as JSON, ASCII or HTML table

wget -qO- 'http://host:8090/api_tbl/token/SELECT … FROM ser_catalog …'
More examples in the FAQ →

New

TopoCast

Web server for browser applications

  • Run current and future toposoft applications in the browser
  • No software rollout to individual workstations
  • Works with all databases of the architecture
  • In development: TopoWeb, our application construction kit for the browser
  • See it live: TopoDesk demo at topodesk.de
Scripting language

Azur

Flexible customisation on the customer side

  • Optimised scripting/programming language for time series, master data, geo data and grids
  • Implement your own analyses, customisations and extensions yourself – no vendor dependency
  • Large set of built-in functions, extends every module with your own logic
Data Logistics

Automated inflow, validated, automated outflow

Services that run around the clock: acquisition, quality assurance and distribution of your measurement data – no manual work.

Inflow

Callisto

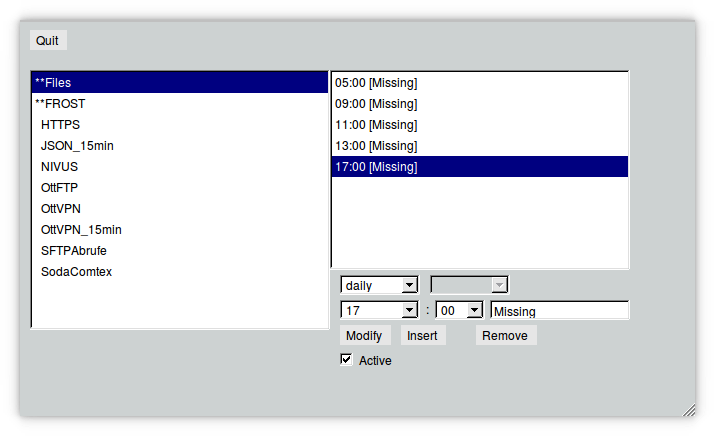
Retrieving measurement data (ingestion)

  • Scheduled retrieval from FTP and HTTP(S) servers, process control systems, modems, TCP/IP
  • Scales from 1 to 1000+ retrievals per day, parallel processes
  • Mail alerts on threshold violations, error logs per station
  • Continuously extended with new retrieval techniques and formats since 2000
Screenshot: Callisto retrieval configuration Screenshot: Callisto status display

ECO

Quality assurance

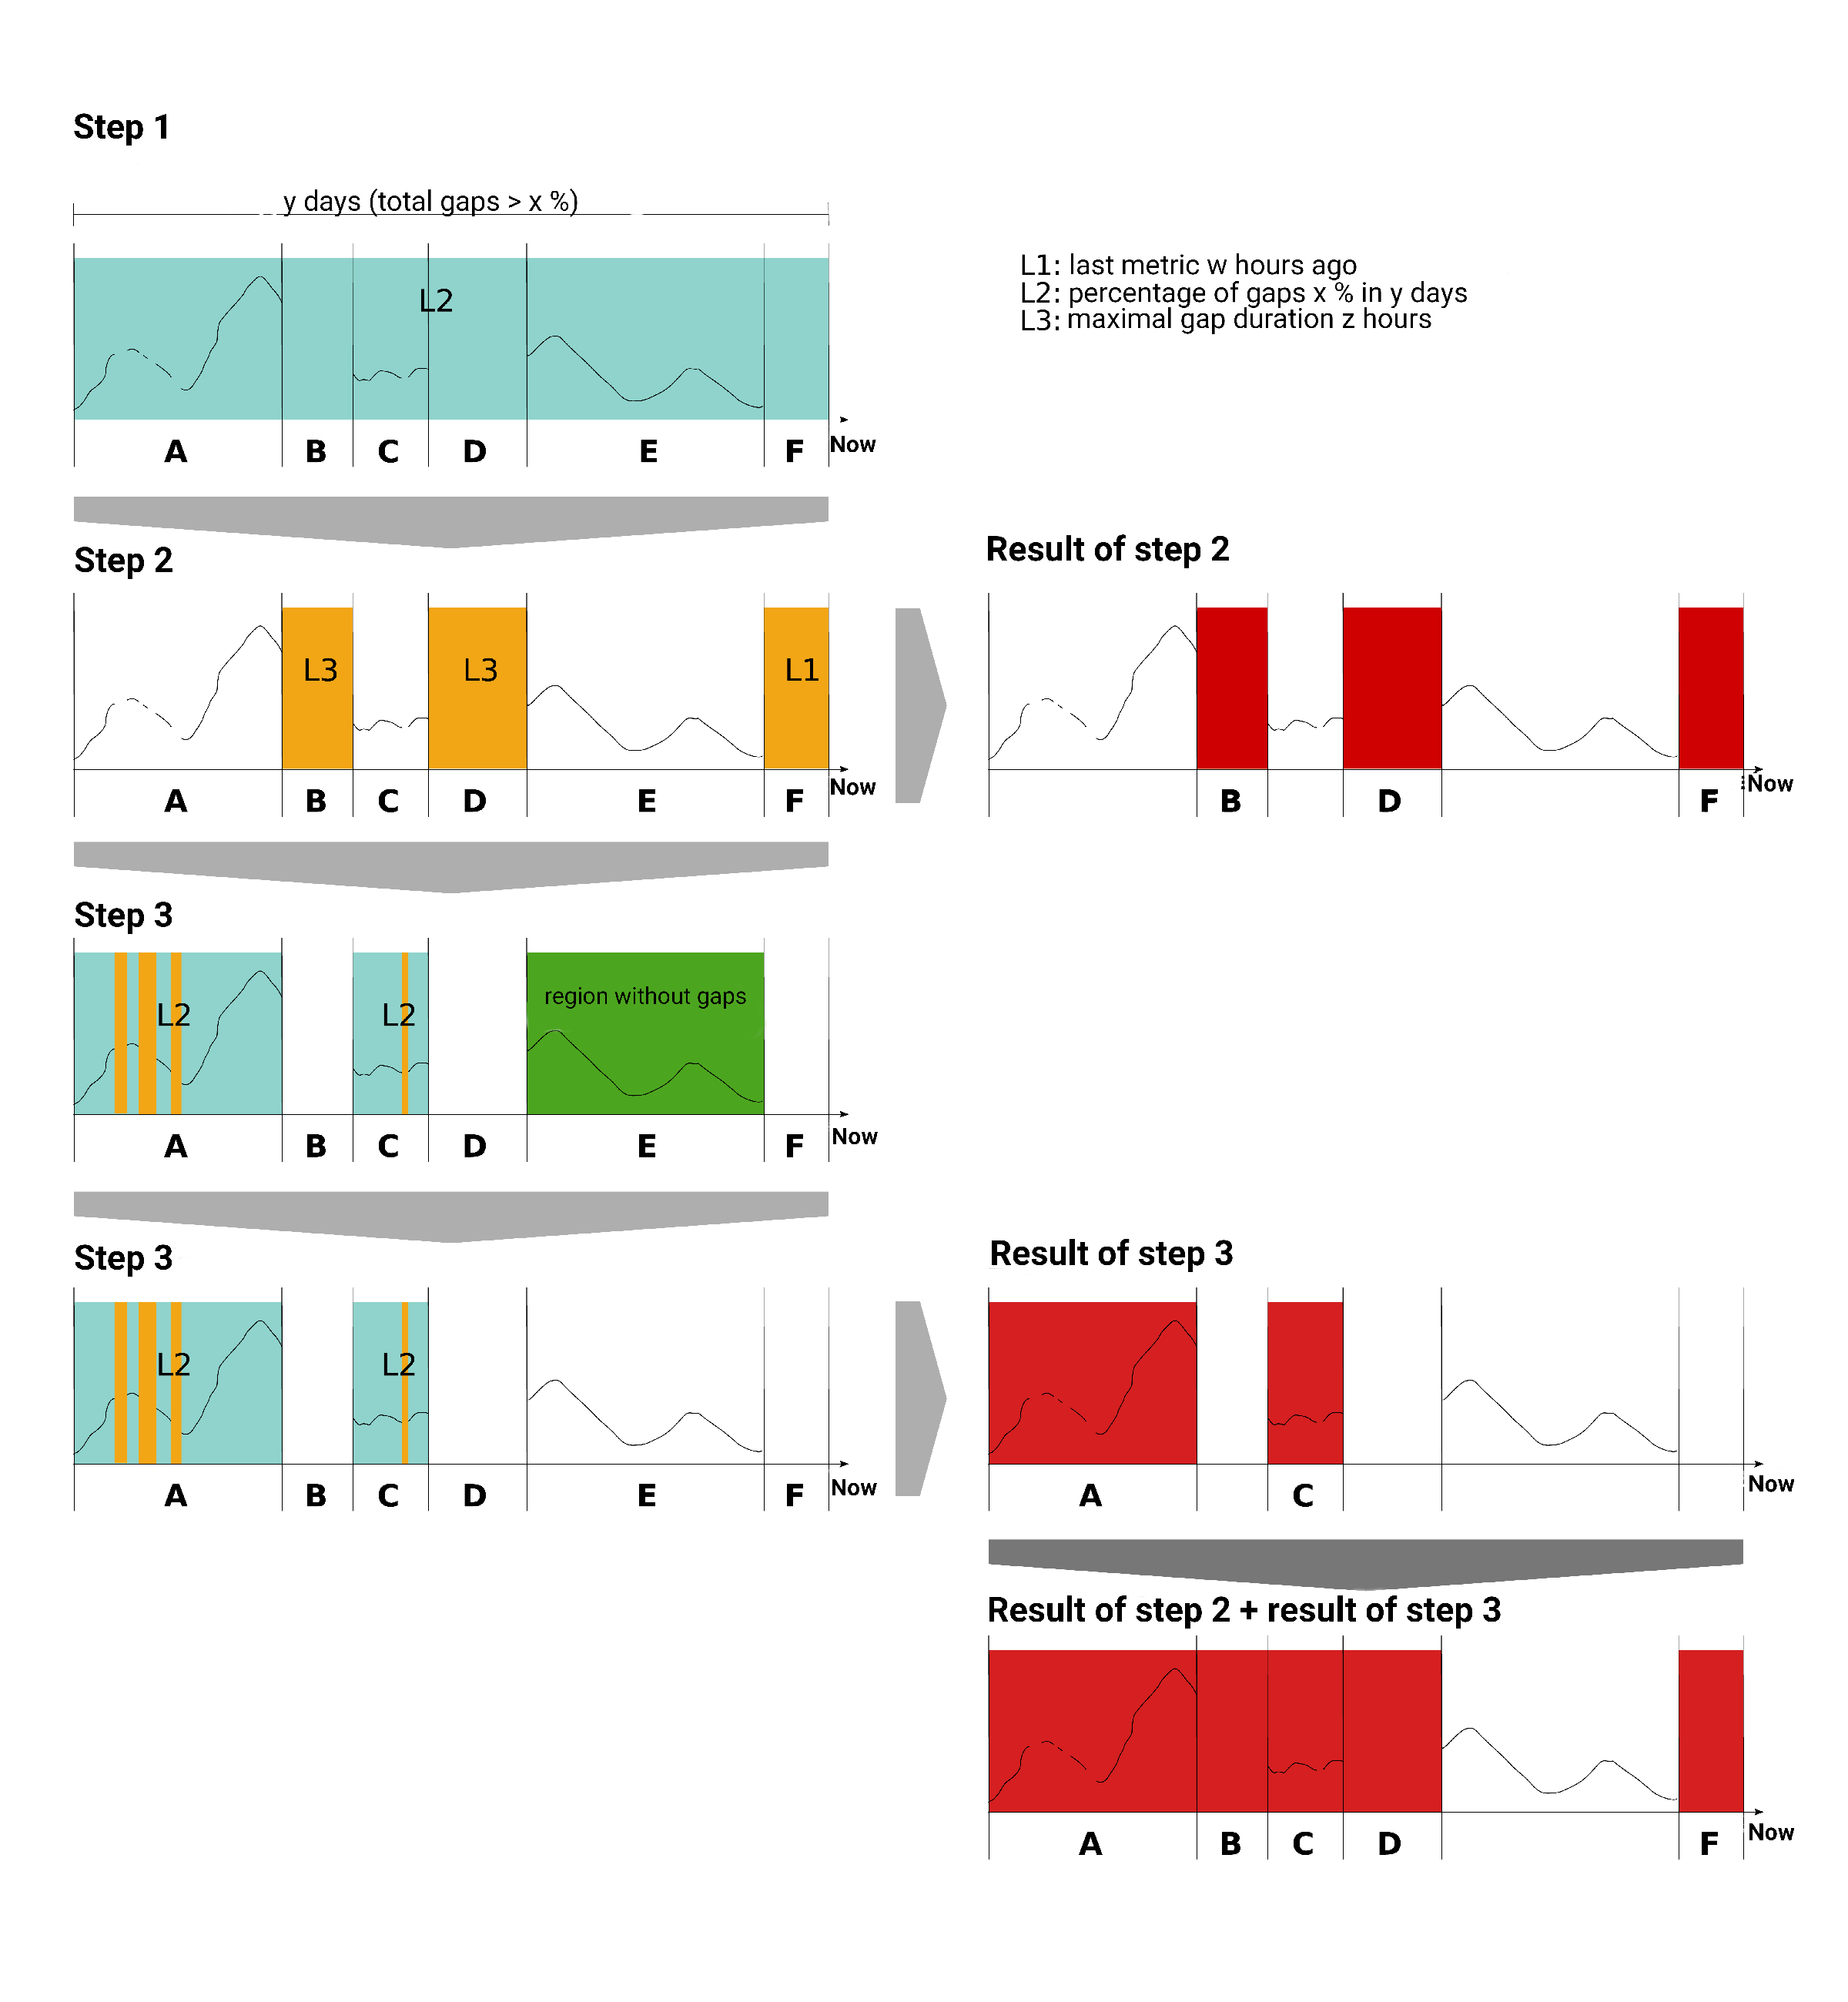
  • Automatic validation and reconstruction of measurement data
  • Event logs for complete traceability
  • Configurable via TopoDesk – raw data is always retained
Screenshot: ECO validation rules and event log
Outflow

Pulsaro

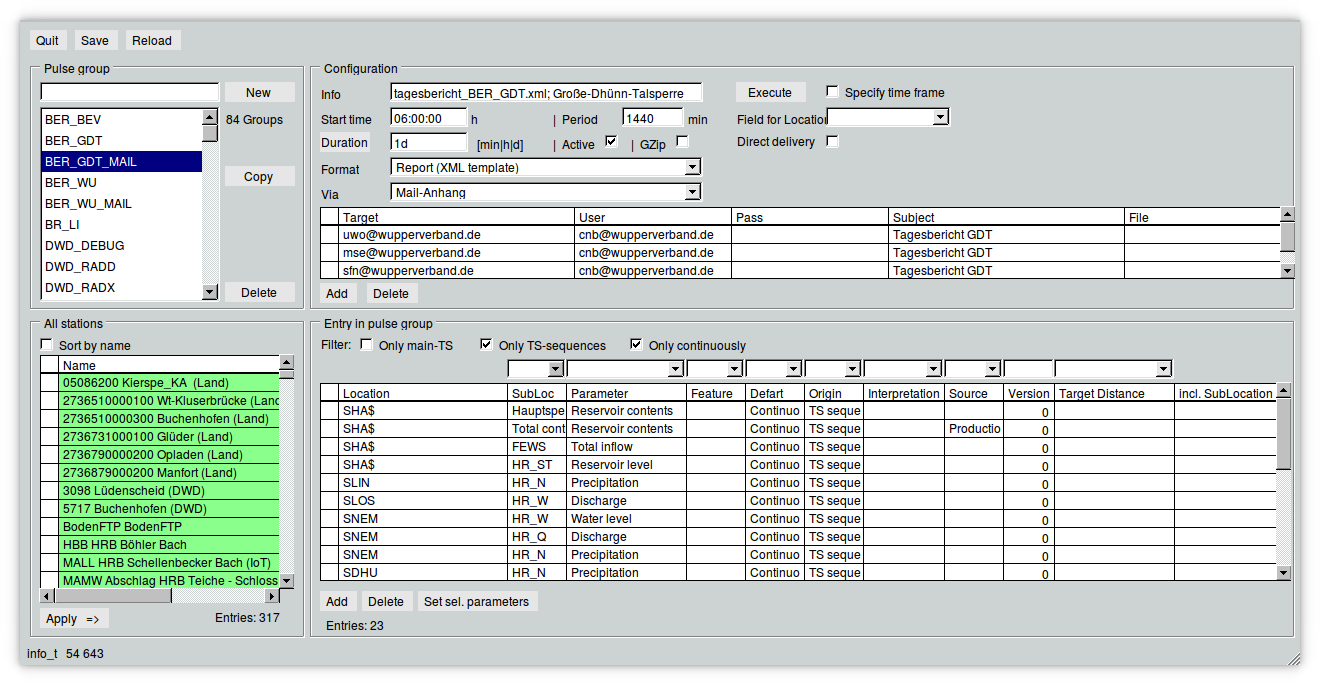
Distributing measurement data (export)

  • Automated exports of time series and standard reports
  • Formats such as Delft-PI, UVF, NearRealTime; delivery via mail, FTP, file folders
  • Optional prior conversion (e.g. 1-minute sums) and compression
Screenshot: Pulsaro export groups Screenshot: Pulsaro export target configuration
Proven Applications

Measurement data management with a graphical interface

Complete working environments for daily data maintenance, validation and analysis – proven for decades in water management and hydrography, on the same data core.

TopoDesk

Modular measurement data management system

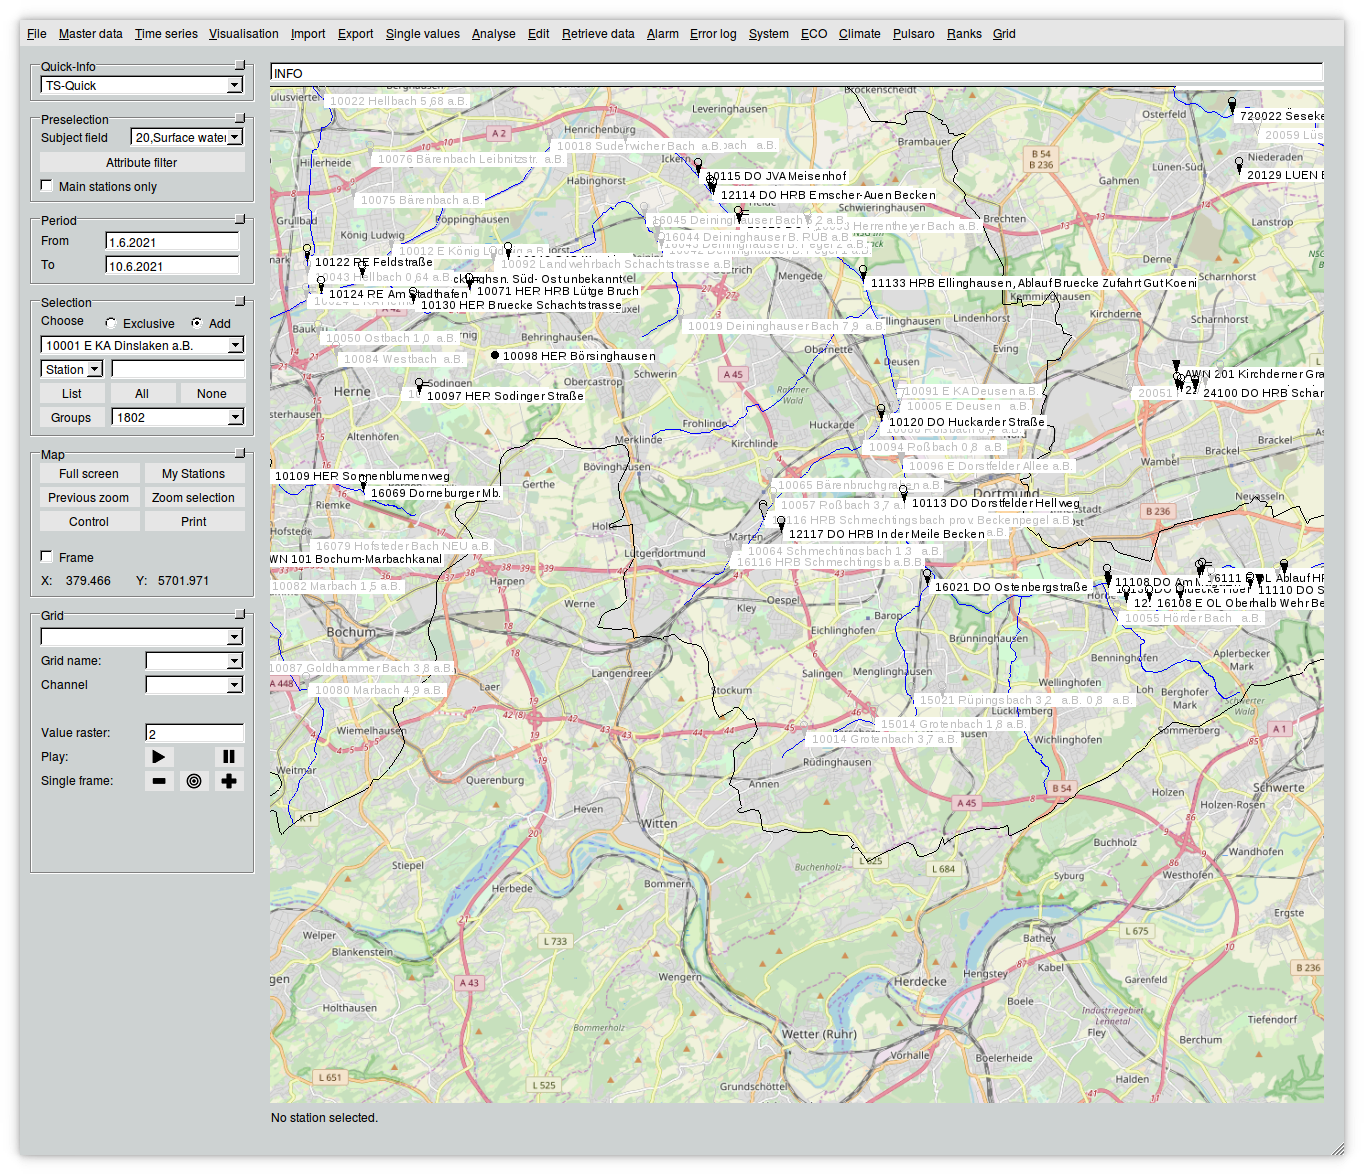
  • Managing and visualising time series, stations, boreholes, pumps and land parcels
  • Interactive map, statistics, calculations, reports
  • Multi-user operation with role-based access rights
Screenshot: TopoDesk main interface with map Screenshot: hydrograph display in TopoDesk
Live demo in the browser: topodesk.de ↗

HyDaMS

Hydrographic data management system

  • Developed for the Hydrographic Central Office in Vienna
  • Used by the hydrographic services of the Austrian federal states
  • Same proven data core foundation as TopoDesk

Damast

Data management system

  • Lean system for managing measurement data
  • Built on the same time series database
Screenshot: Damast main view

TopoMobil

Mobile data capture in the field

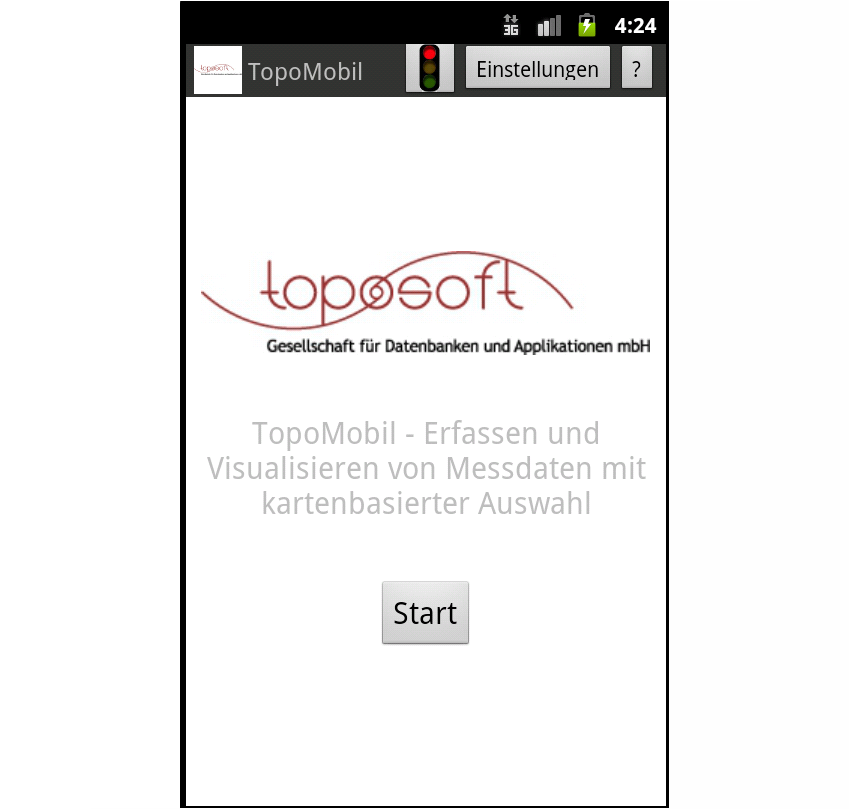
  • Capture readings with the Android app
  • Record and acknowledge field notes
  • Register and deregister measuring devices
Screenshot: TopoMobil Android app

TopoVit

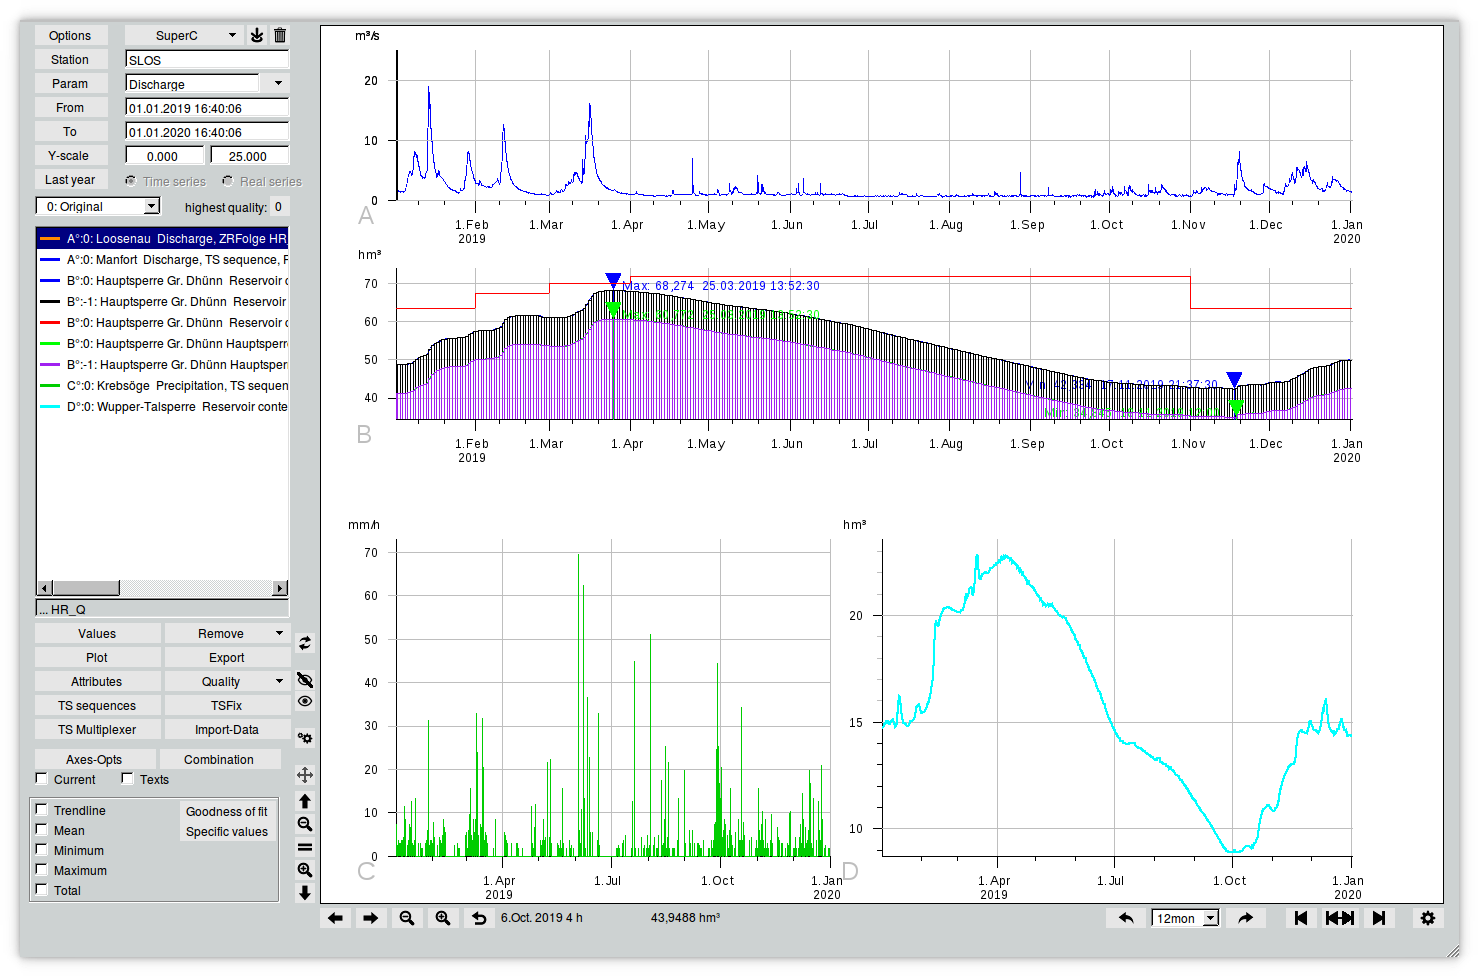
Visualising and editing time series

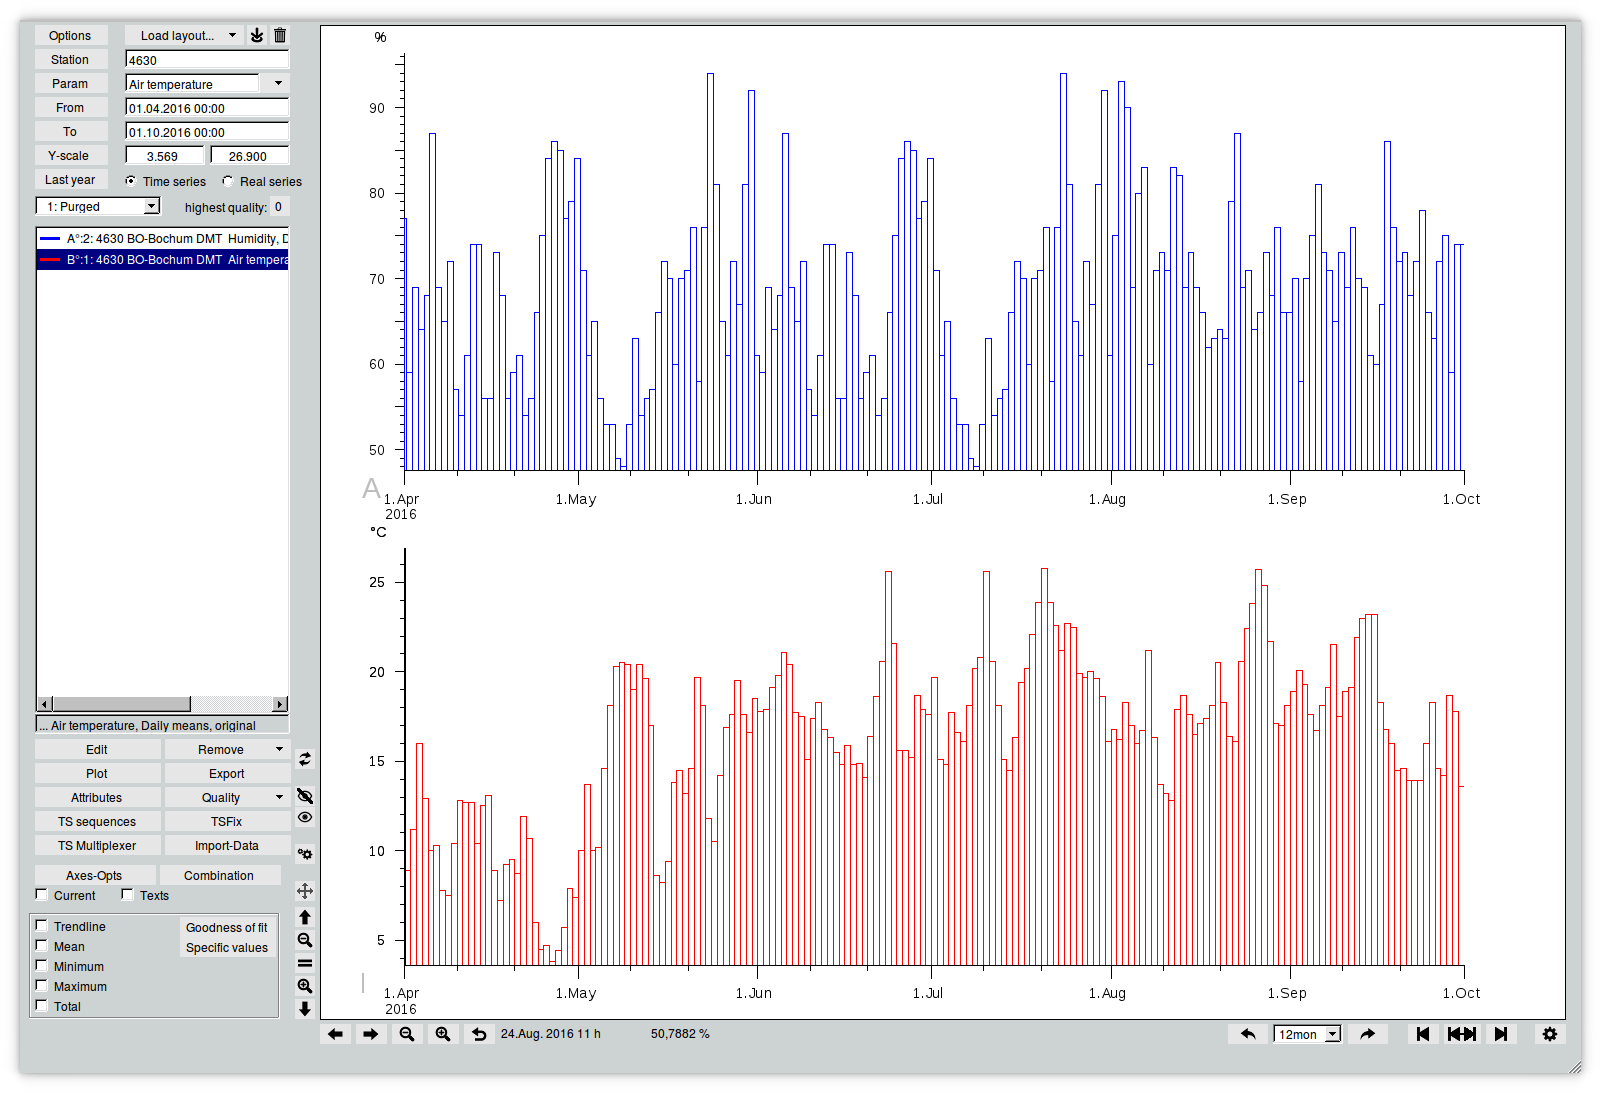
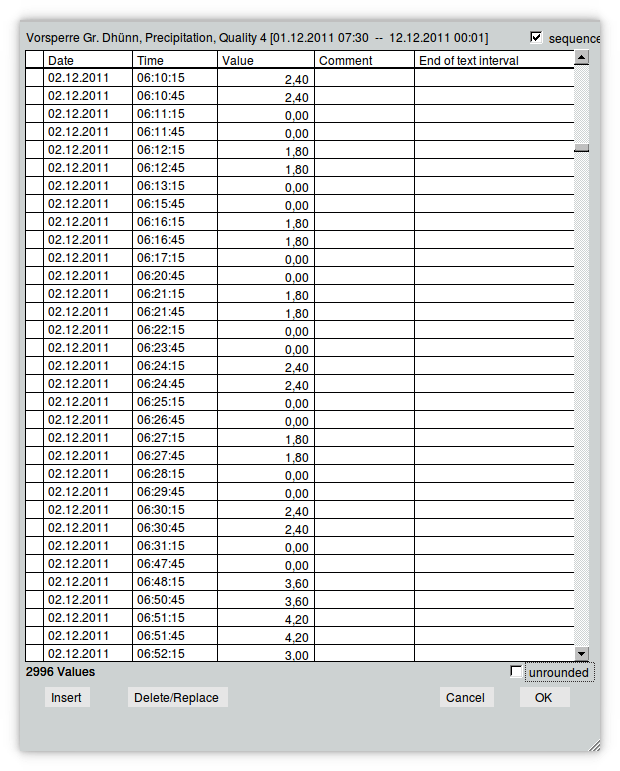
  • Display hydrographs, zoom, edit graphically and in tables
  • Design layouts interactively and reuse them
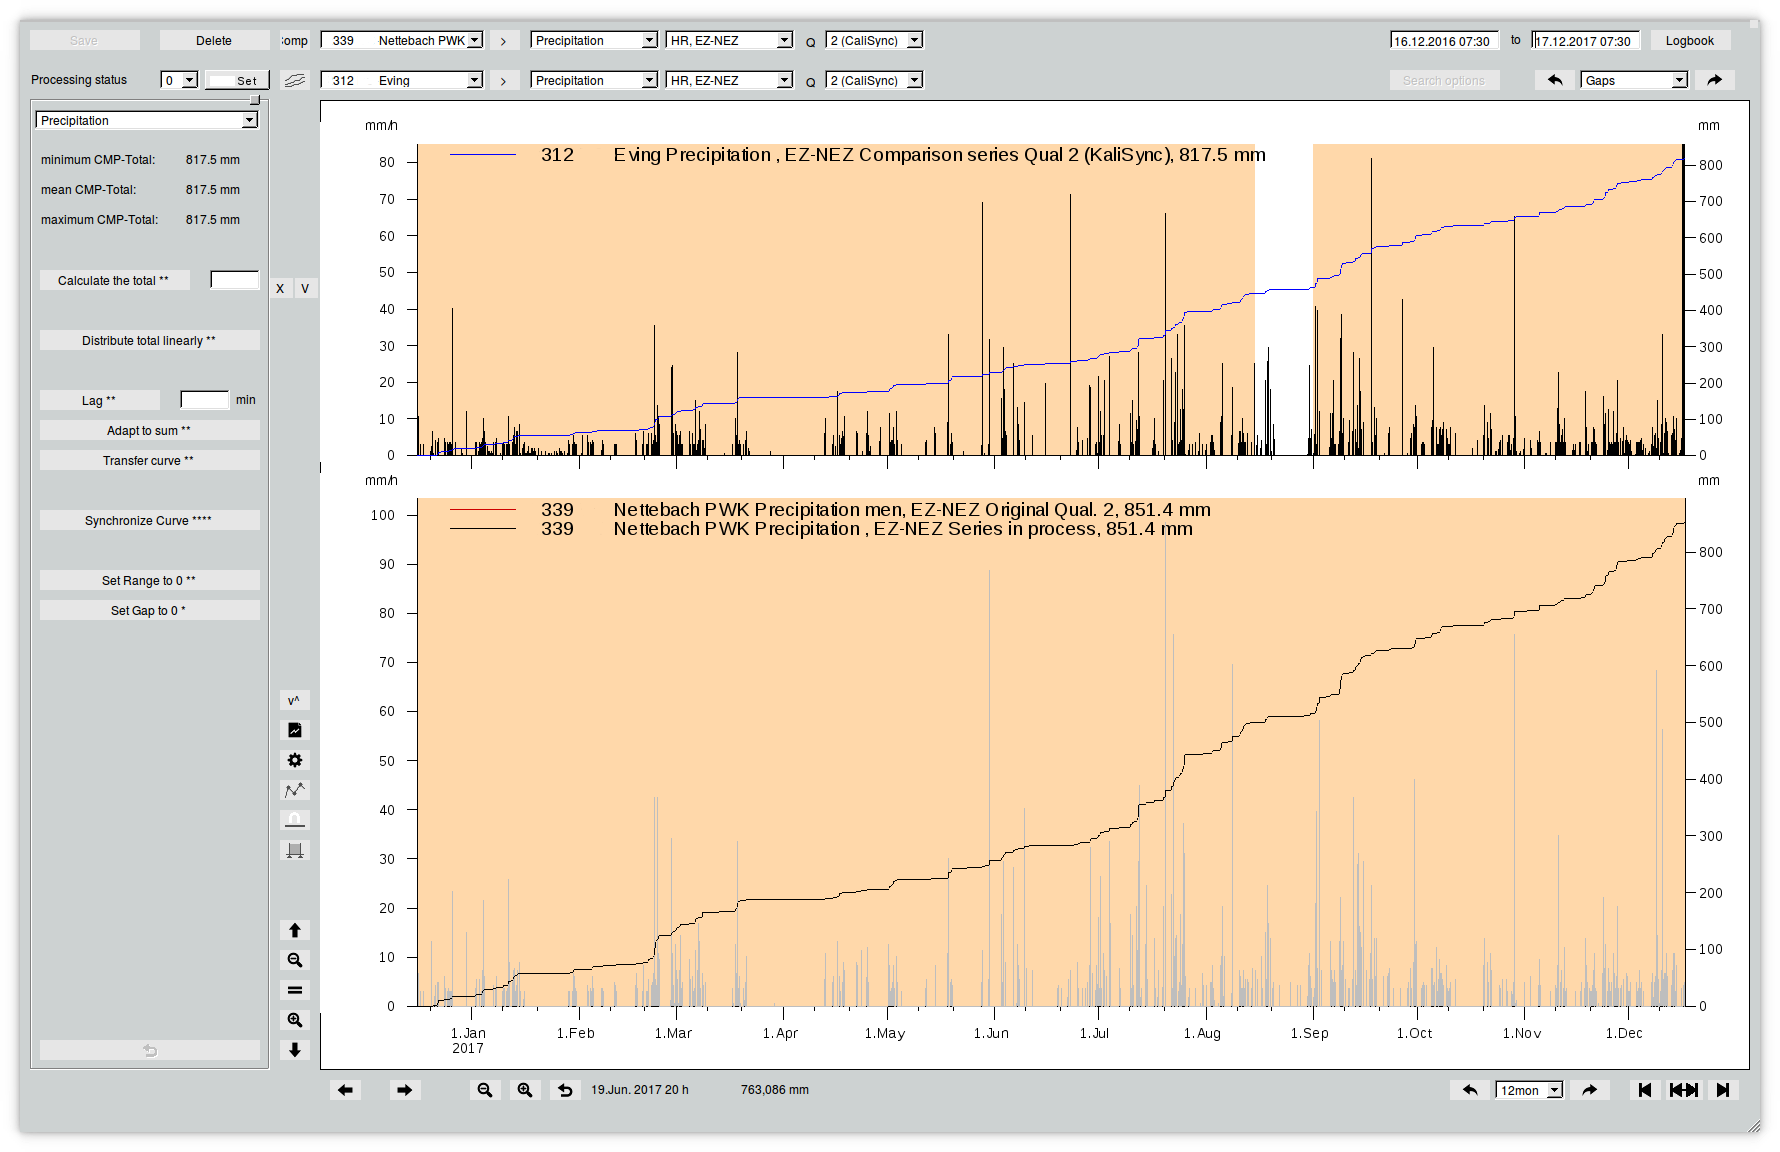
Screenshot: TopoVit time series editor Screenshot: multiple hydrographs in TopoVit

Toast

Middleware for your website

  • Generates graphics (PNG) from predefined layouts for your website
  • Layouts created in TopoVit
Screenshot: hydrograph graphic generated by Toast
Analysis & Specialised Modules

Tools for particular tasks

All modules integrate into the main products – and also run standalone with the toposoft time series database.

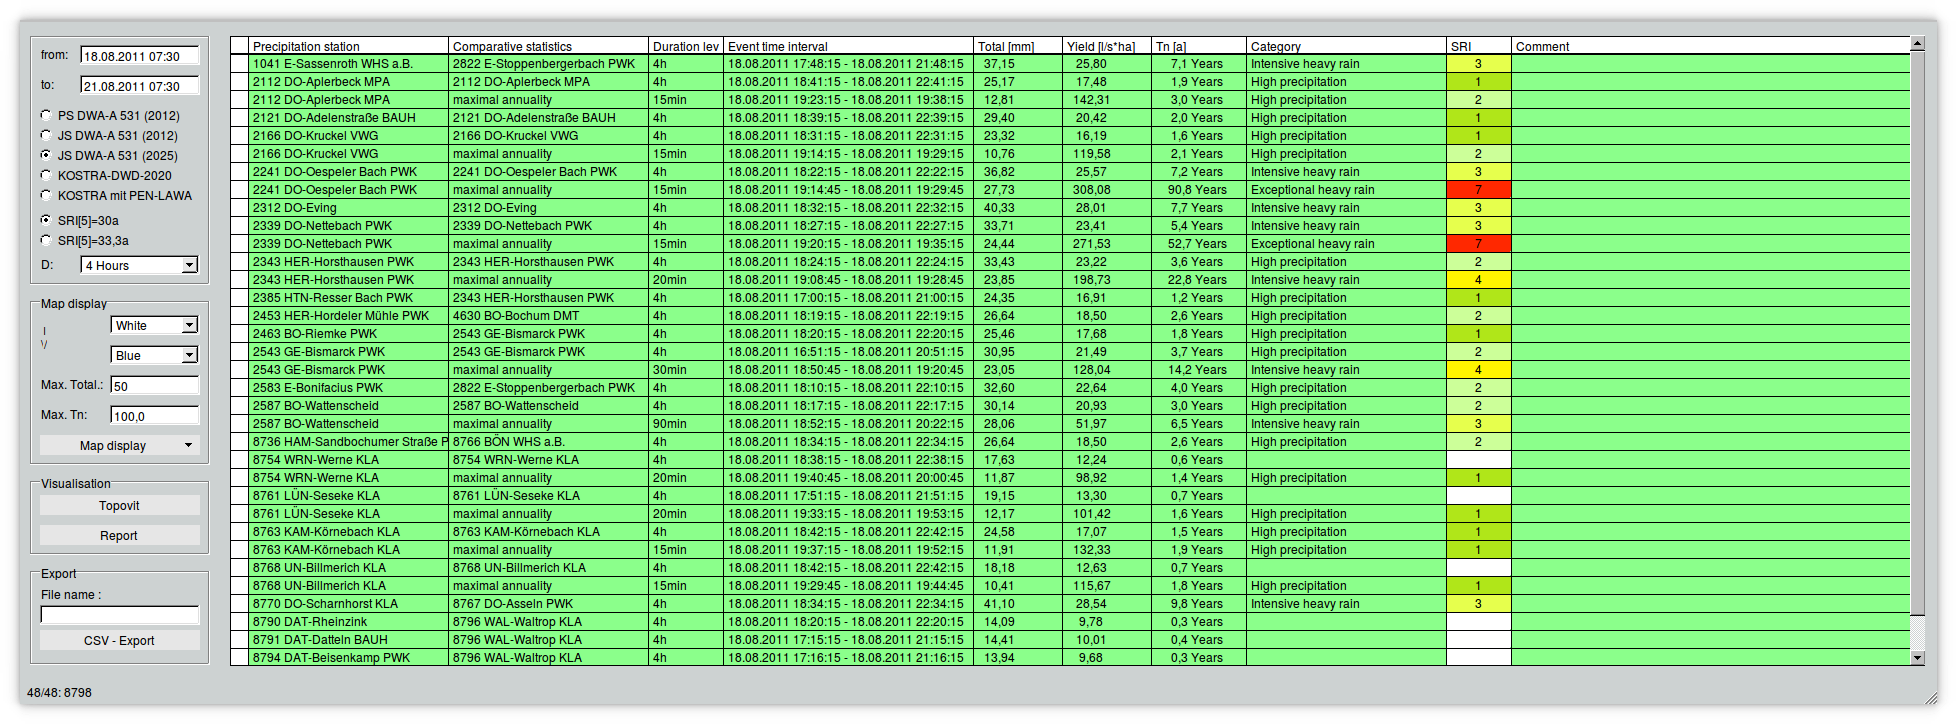
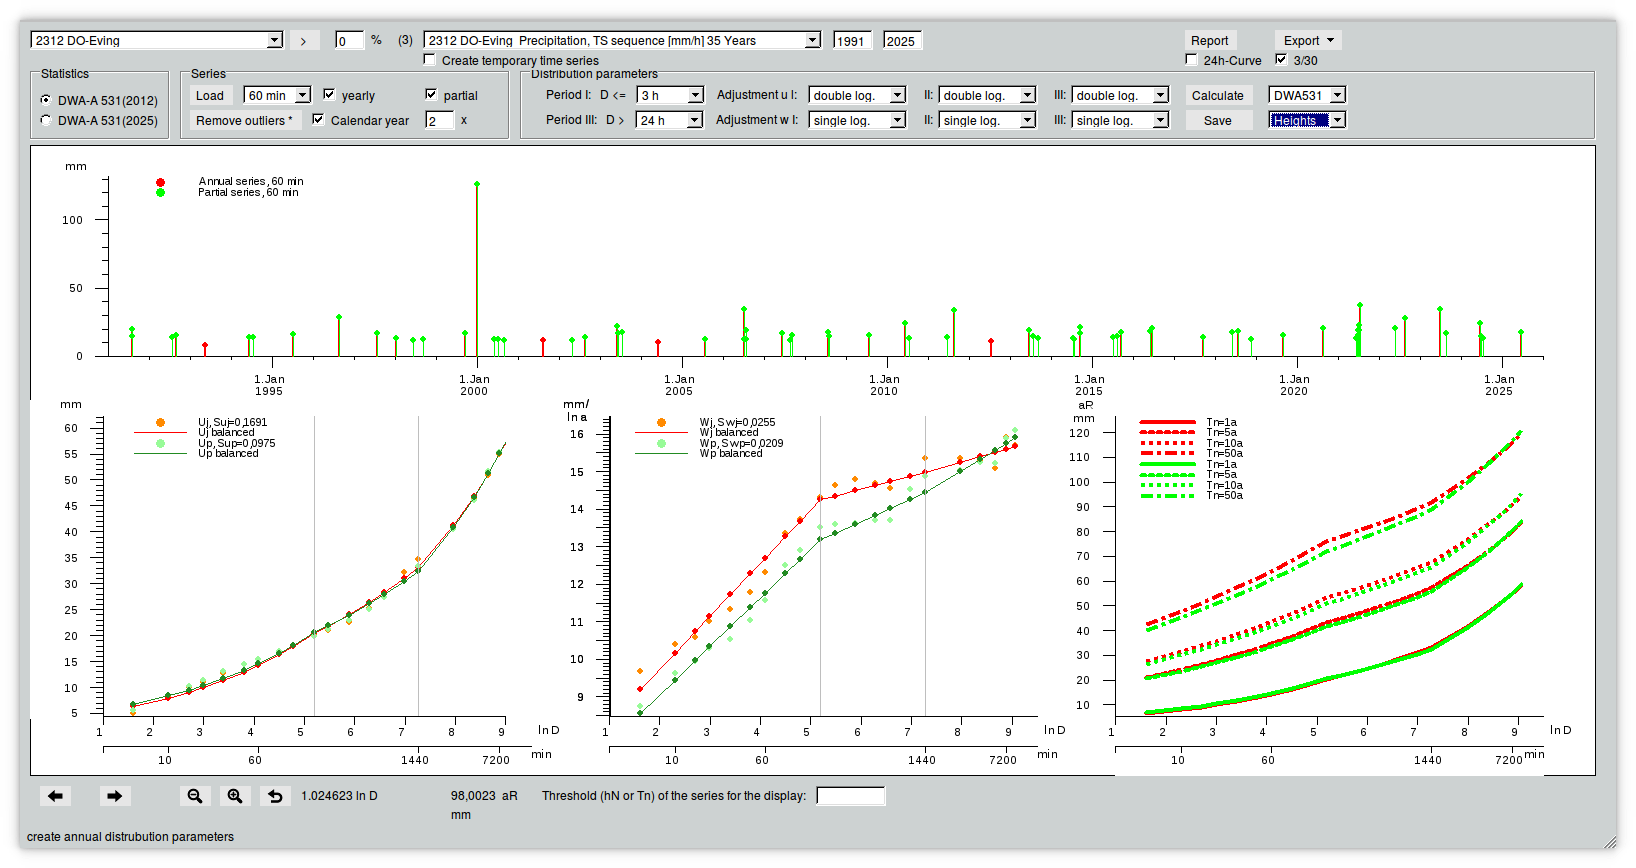
Heavy Rain Analysis

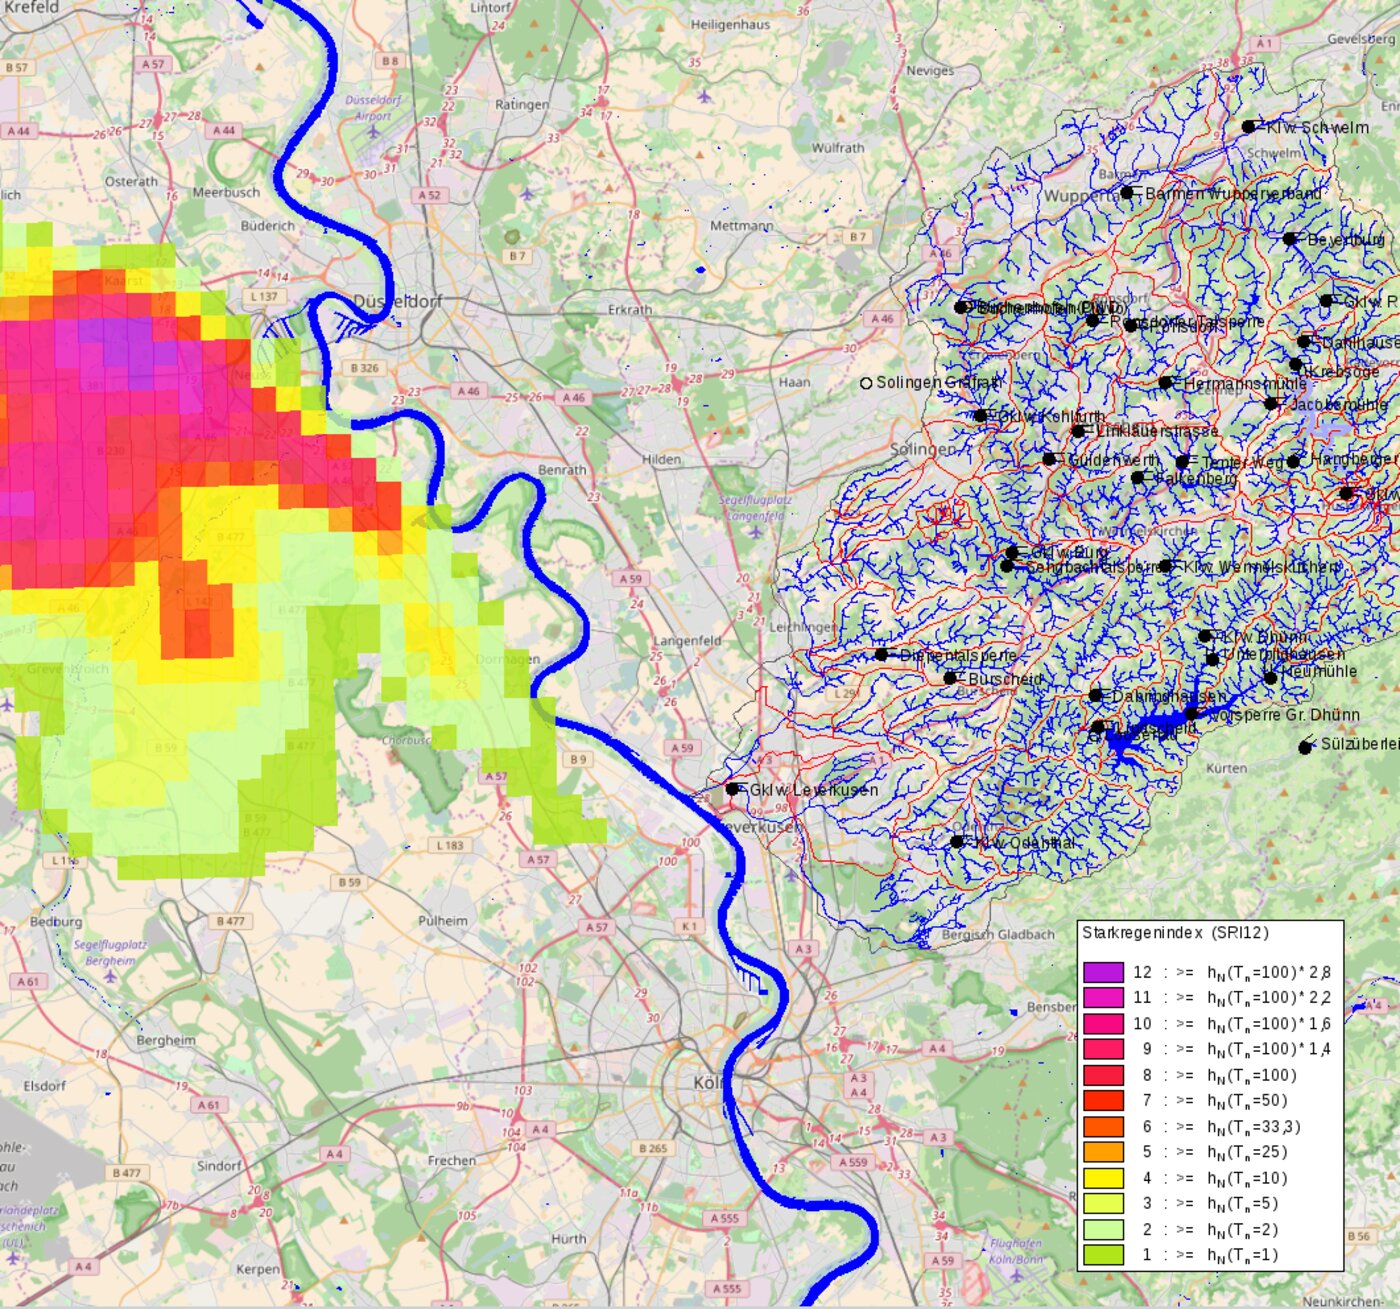
Detect and assess events

  • Analysis of heavy rainfall events from station and radar data
Screenshot: heavy rain analysis

TopoCity

Radar data in urban areas

  • Time-resolved display (online and offline)
  • Radar data vs. station data as time series
Screenshot: TopoCity radar display

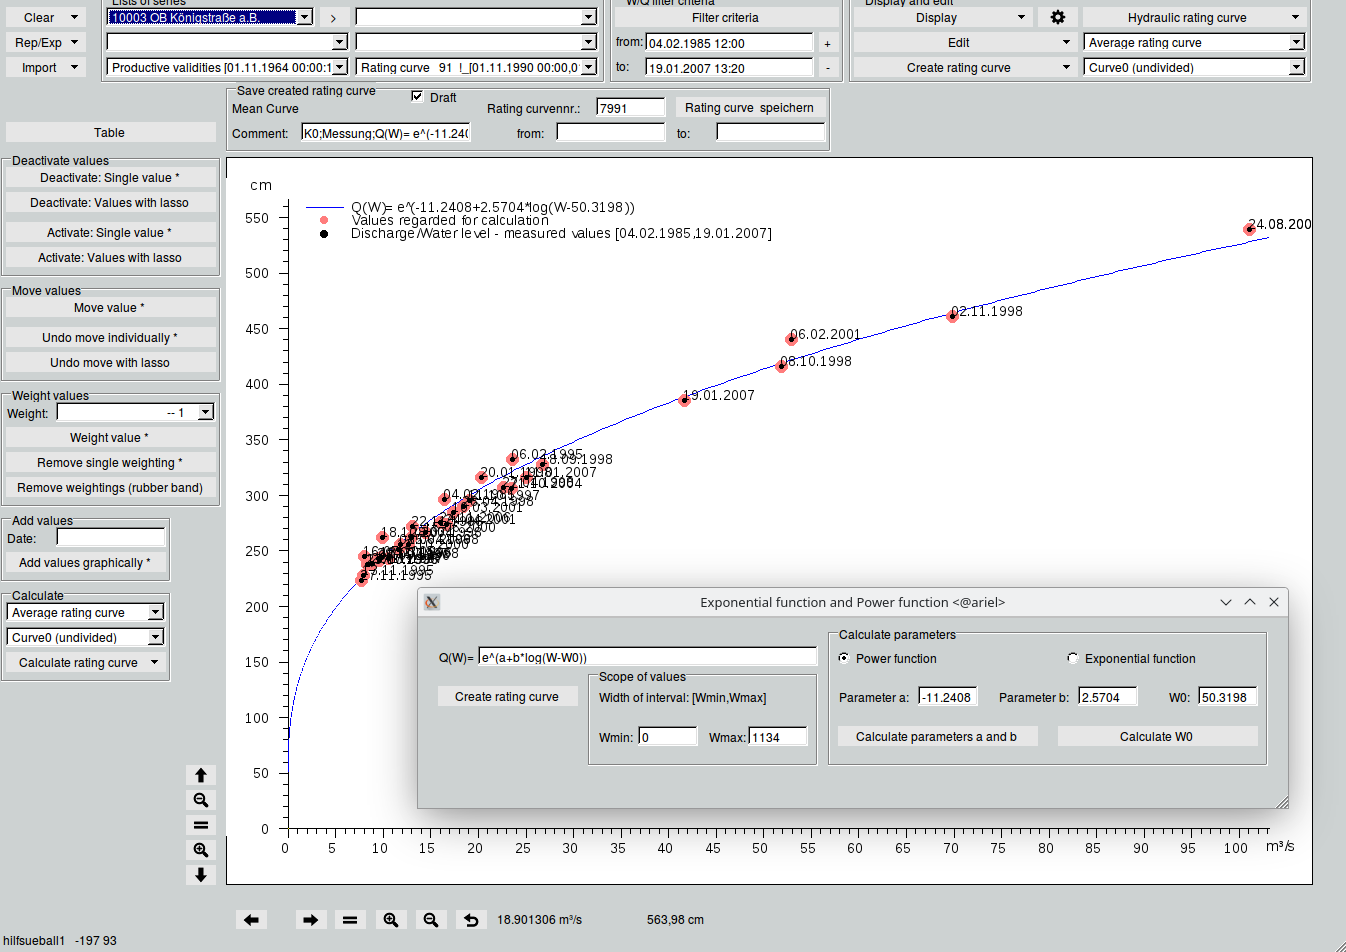
QWest

Discharge measurement

  • Analysis of discharge and flow measurements
Screenshot: QWest measurement analysis

ZRFix

Repairing time series

  • Tools for correcting and completing time series

OSM / Geotools

Maps & geo data

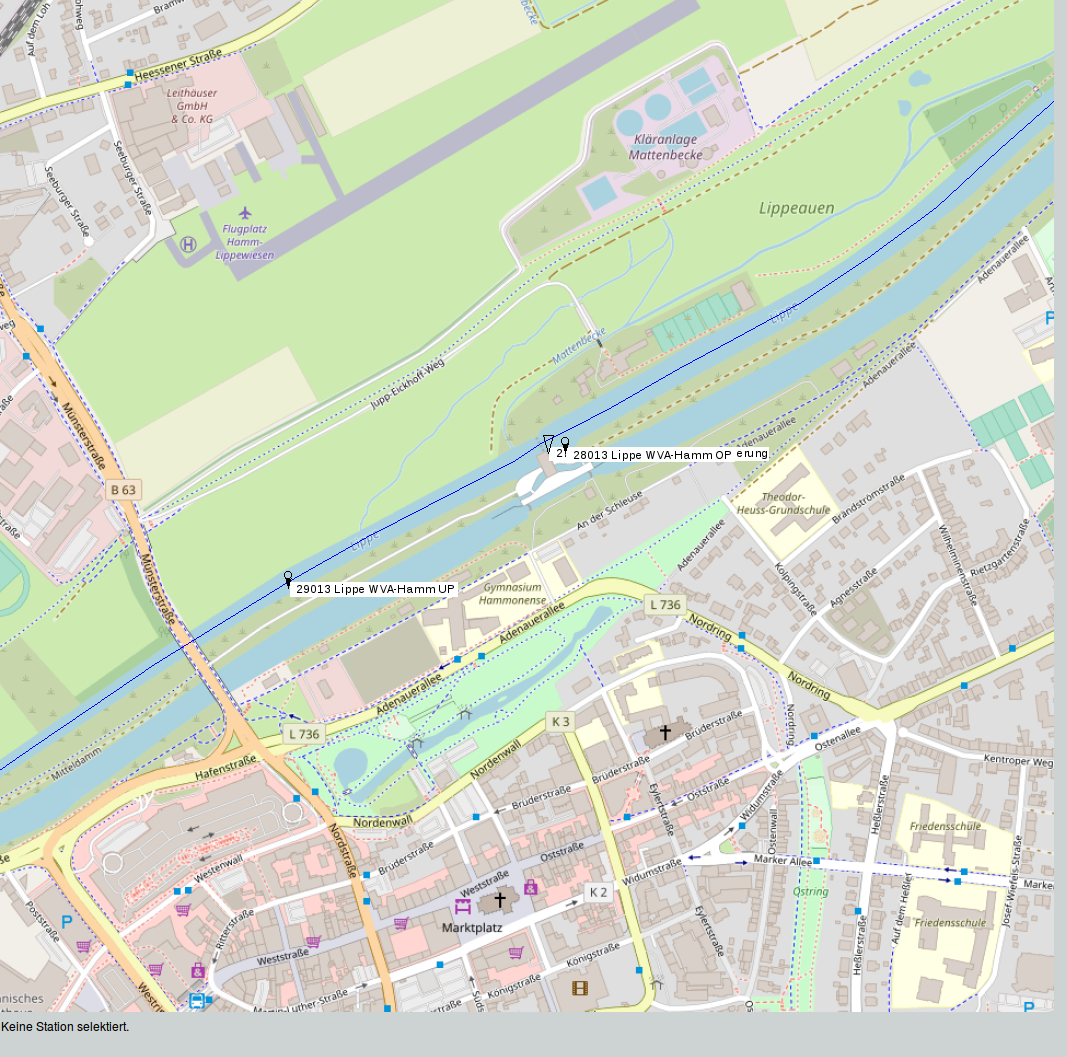
  • OpenStreetMap integration and geo data tools for map display

TopoCloud

From the station straight to the web

  • Publish measurement data online
Proven Interfaces

Established access points for existing systems

These interfaces are in production at many customer sites and remain maintained. For new integrations we recommend TopoFlix.

TSTP

Network interface for third-party systems

  • Read and write access for third-party systems (XML)
  • Central part of the data hub between associations and authorities

DBTP

Network access to databases

  • Network access to databases including in-memory data storage

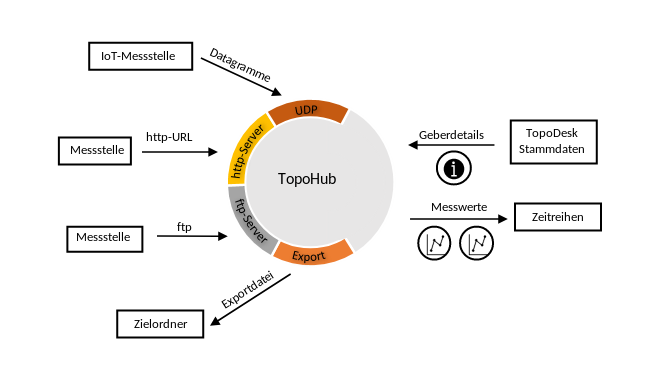
TopoHub

Relaying measurement data automatically

  • Processing of UDP datagrams, multiprocessing
  • Immediate completion of time series

Request product advice