TOPODESK - HYDAMS - DAMASTModular system for managing measurement data
TopoDesk is used for the administration, maintenance, visualization, calculation, and analysis of time-referenced observations and the control of data transfer processes (for example Callisto or Pulsaro). TopoDesk can run in network mode or locally. It allows multiple users to work at the same time. Thus, data maintenance, analysis, and importing can take place in parallel. The data is stored in a central data pool, which is connected to all workstations via a LAN (Local Area Network). Through a user administration with login the administrator can assign technically oriented access rights. The entire system is very easy to use and graphically interactive.
The speed of the system, the extensive possibilities, and many tools that facilitate the work support you in your job. This can be seen, for example, in that everything you select and enter in the map is passed on to subfunctions. A pragmatic, efficient, and thorough analysis of the data is ensured above all by the simple operation, the short response times, and the small but important functionalities in detail. In addition, all analyses and verifications are generally produced as reports. TopoDesk is based on the time series management TopoDB, ag (for the graphically interactive user interfaces), and Azur for working with time series data.
SUMMARY OF THE FUNCTIONS
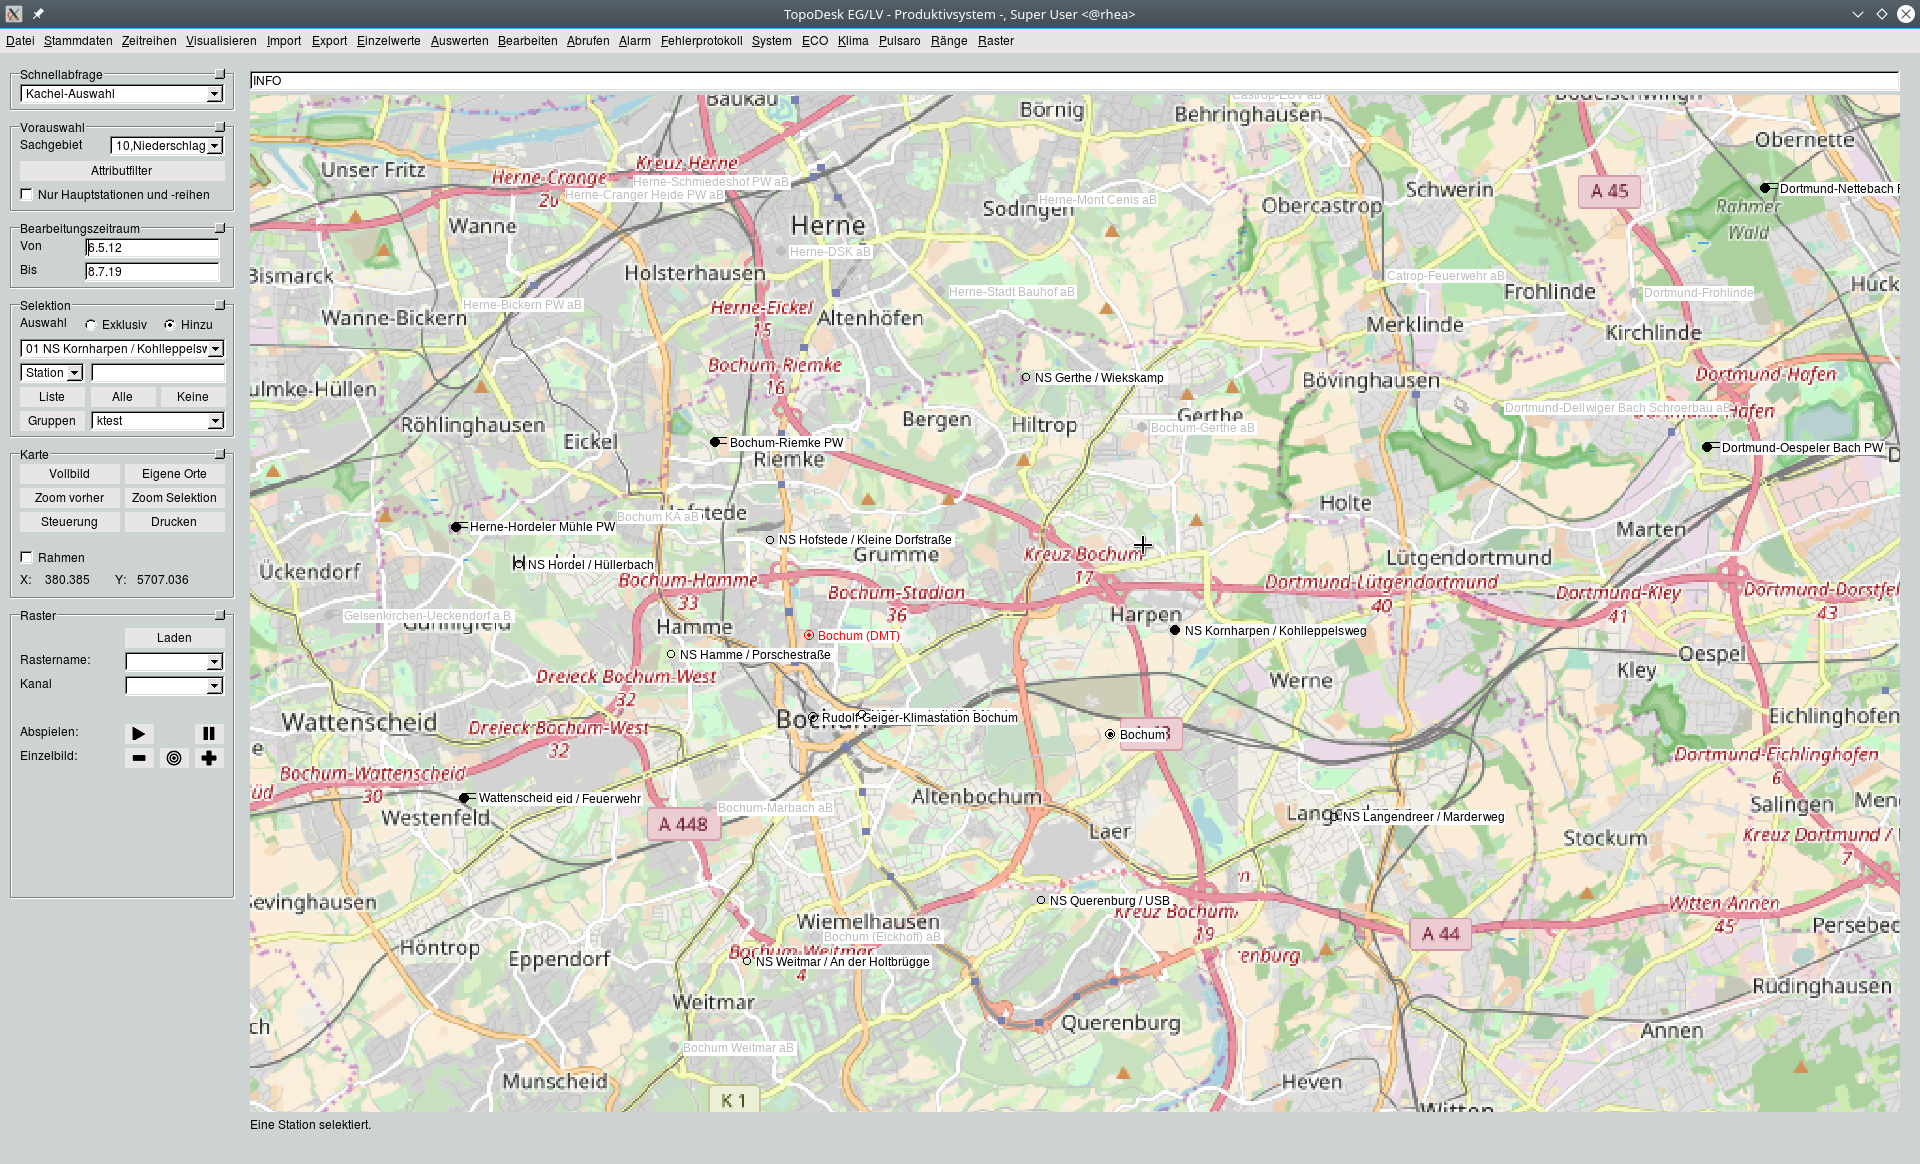
Central user interface It has an interactive map that visualizes gauging stations and any other geographic layers. At the same time, it provides you with control elements with which you can navigate and select. Here you also have the option of making presets that are passed on to the subprograms (processing time frame, parameters). You can print out the map of the selected area with all of the elements shown.
Map control It gives you the ability to change the map view by loading and removing layers and scenery, or changing the appearance of layers and text. You can also load measuring-station layers of other subject areas here.
System Tools Here you decide on general settings and determine the appearance of TopoDesk. For example, you can choose whether the map should be displayed or set the default settings for the printer. From here you can generate the measuring station overview from the master data. Also very helpful is the possibility to define and store groups of stations (also different subject areas). These can, once defined, be very easily selected in the map and used for further processing. In addition, version information can be queried.
Master data With this menu item you can enter, change, and delete master data. Using filter functions, you can select specific stations and make them available for targeted processing. Your selection thus serves as the basis for analyses, reports, and graphics.
Code-relations These are keyed lists that you use to define the entries of all selected lists.
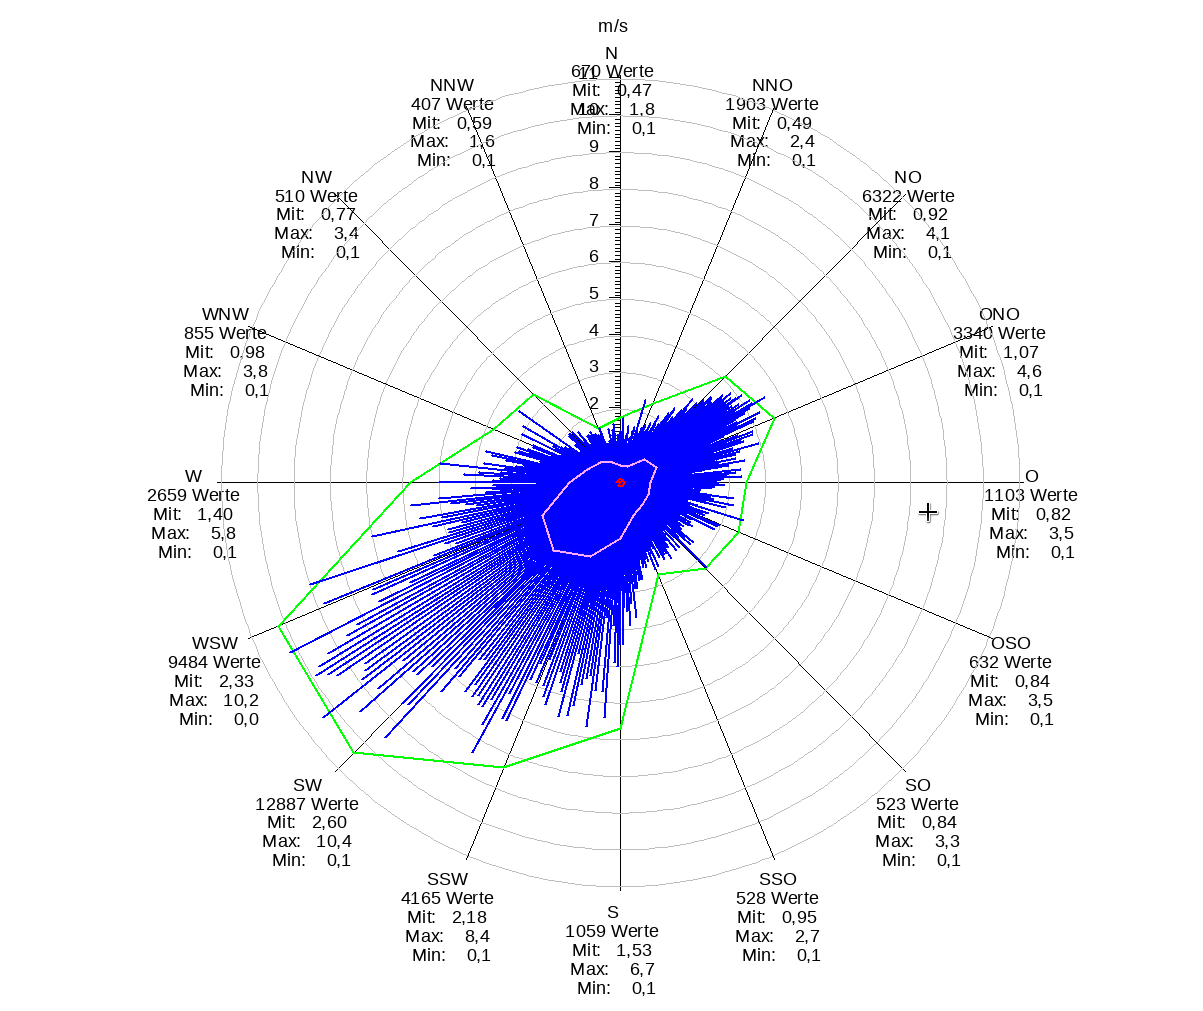
Frequency and duration Frequencies and duration lines of the selected parameter of one or more stations can be graphically displayed for comparison. It analyzes means, minima, maxima, or weights for selected intervals. For continuous data, any interval widths can be calculated.
Time series Time series are ordered in TopoDesk to the measuring stations, and are clearly defined by their attributes. The measuring stations can be used to call the series in the system. This is done using the map, the station name, or a special time series filter. The attributes of existing series can be edited without much effort. In addition, you can query the availability of time series of selected measuring stations in a certain period of time. With the functions for editing time series sequences, any time series sections of different time series can be combined with each other, and modified with the help of formulas (e.g., time series from source series water level).
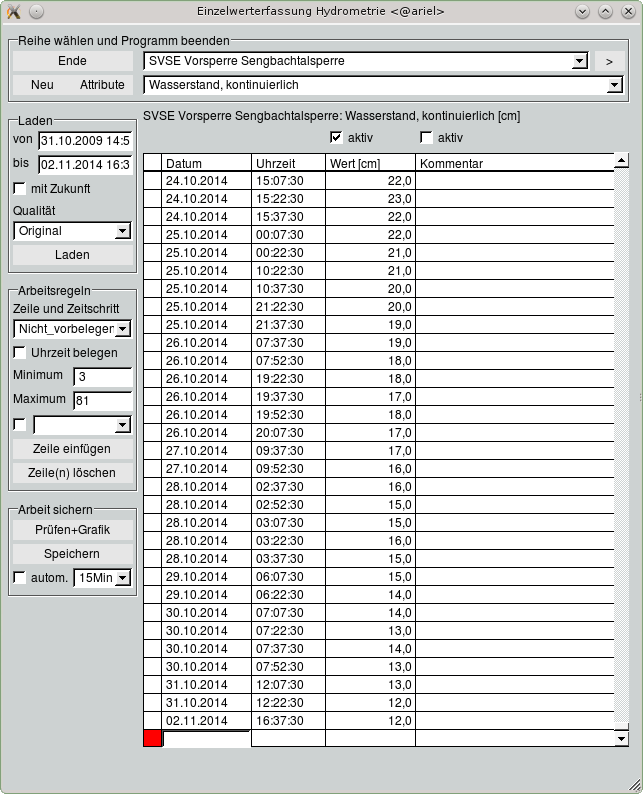
Single-value recording This is the tabular recording and modification of interval and instantaneous time series as well as long-term values.
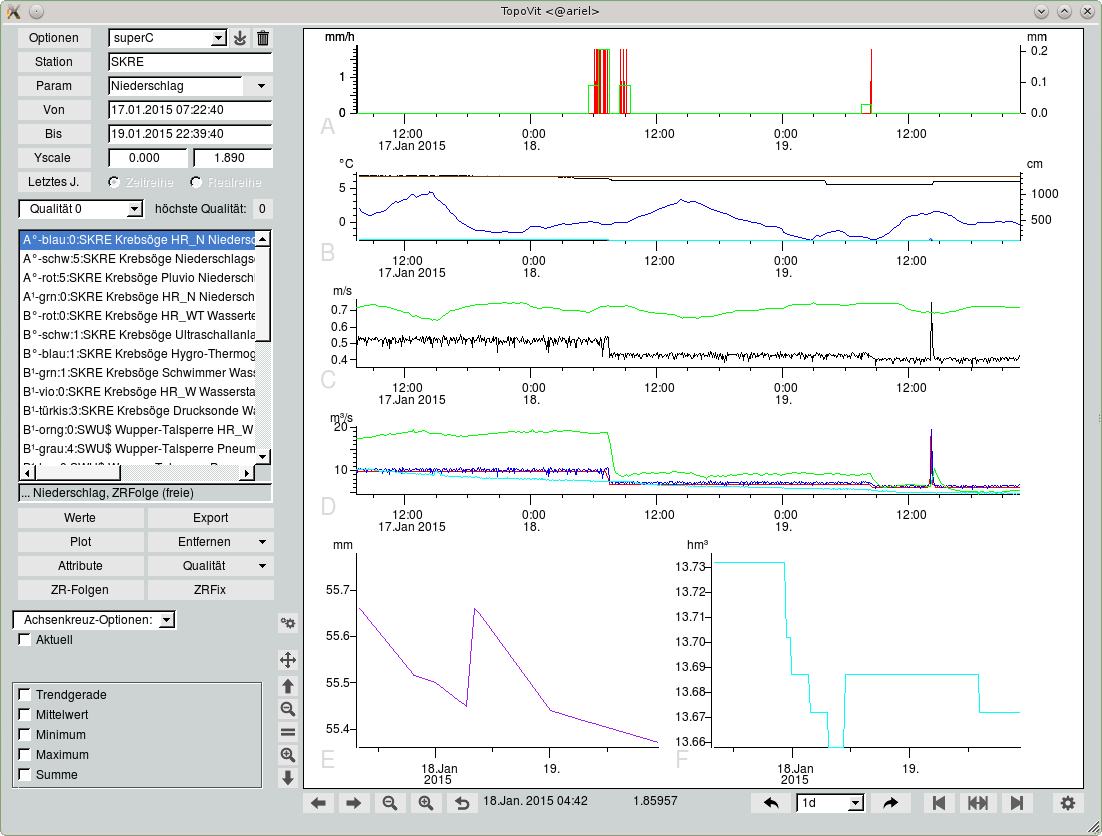
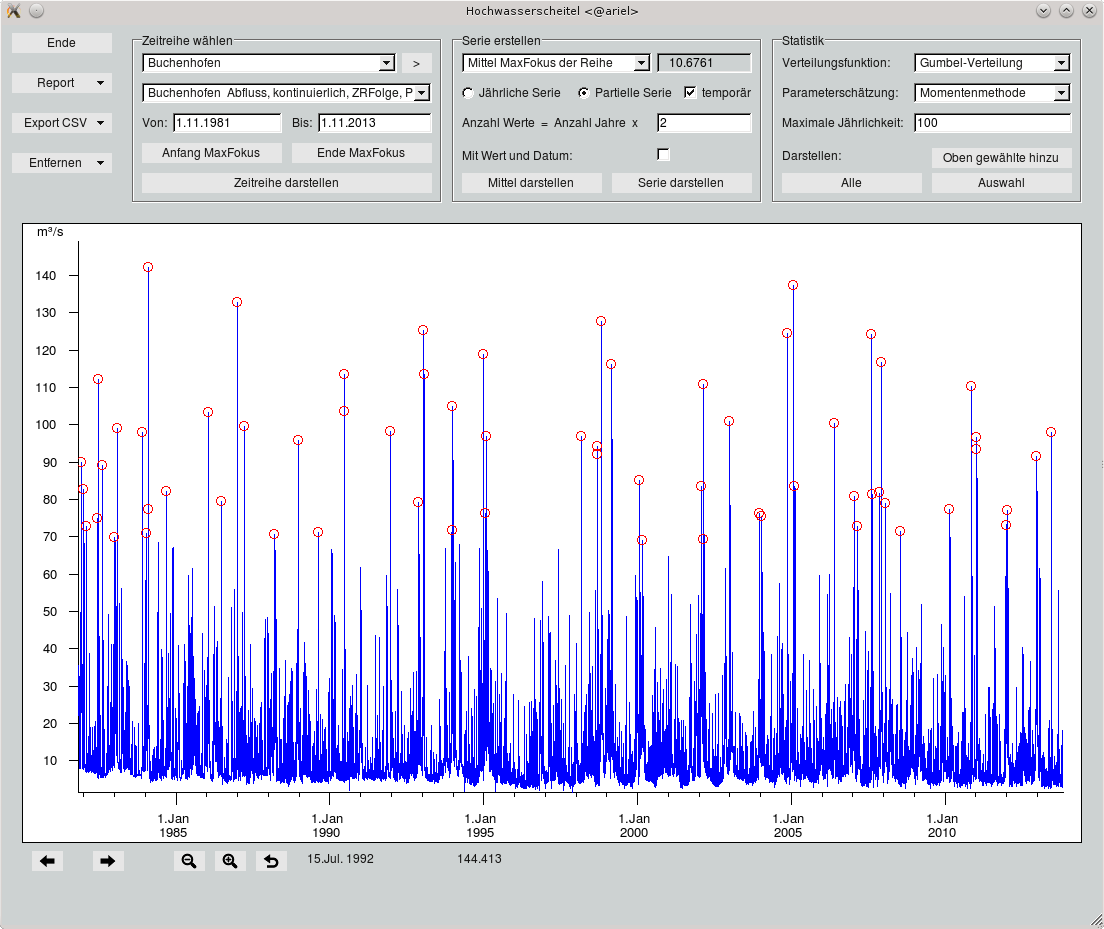
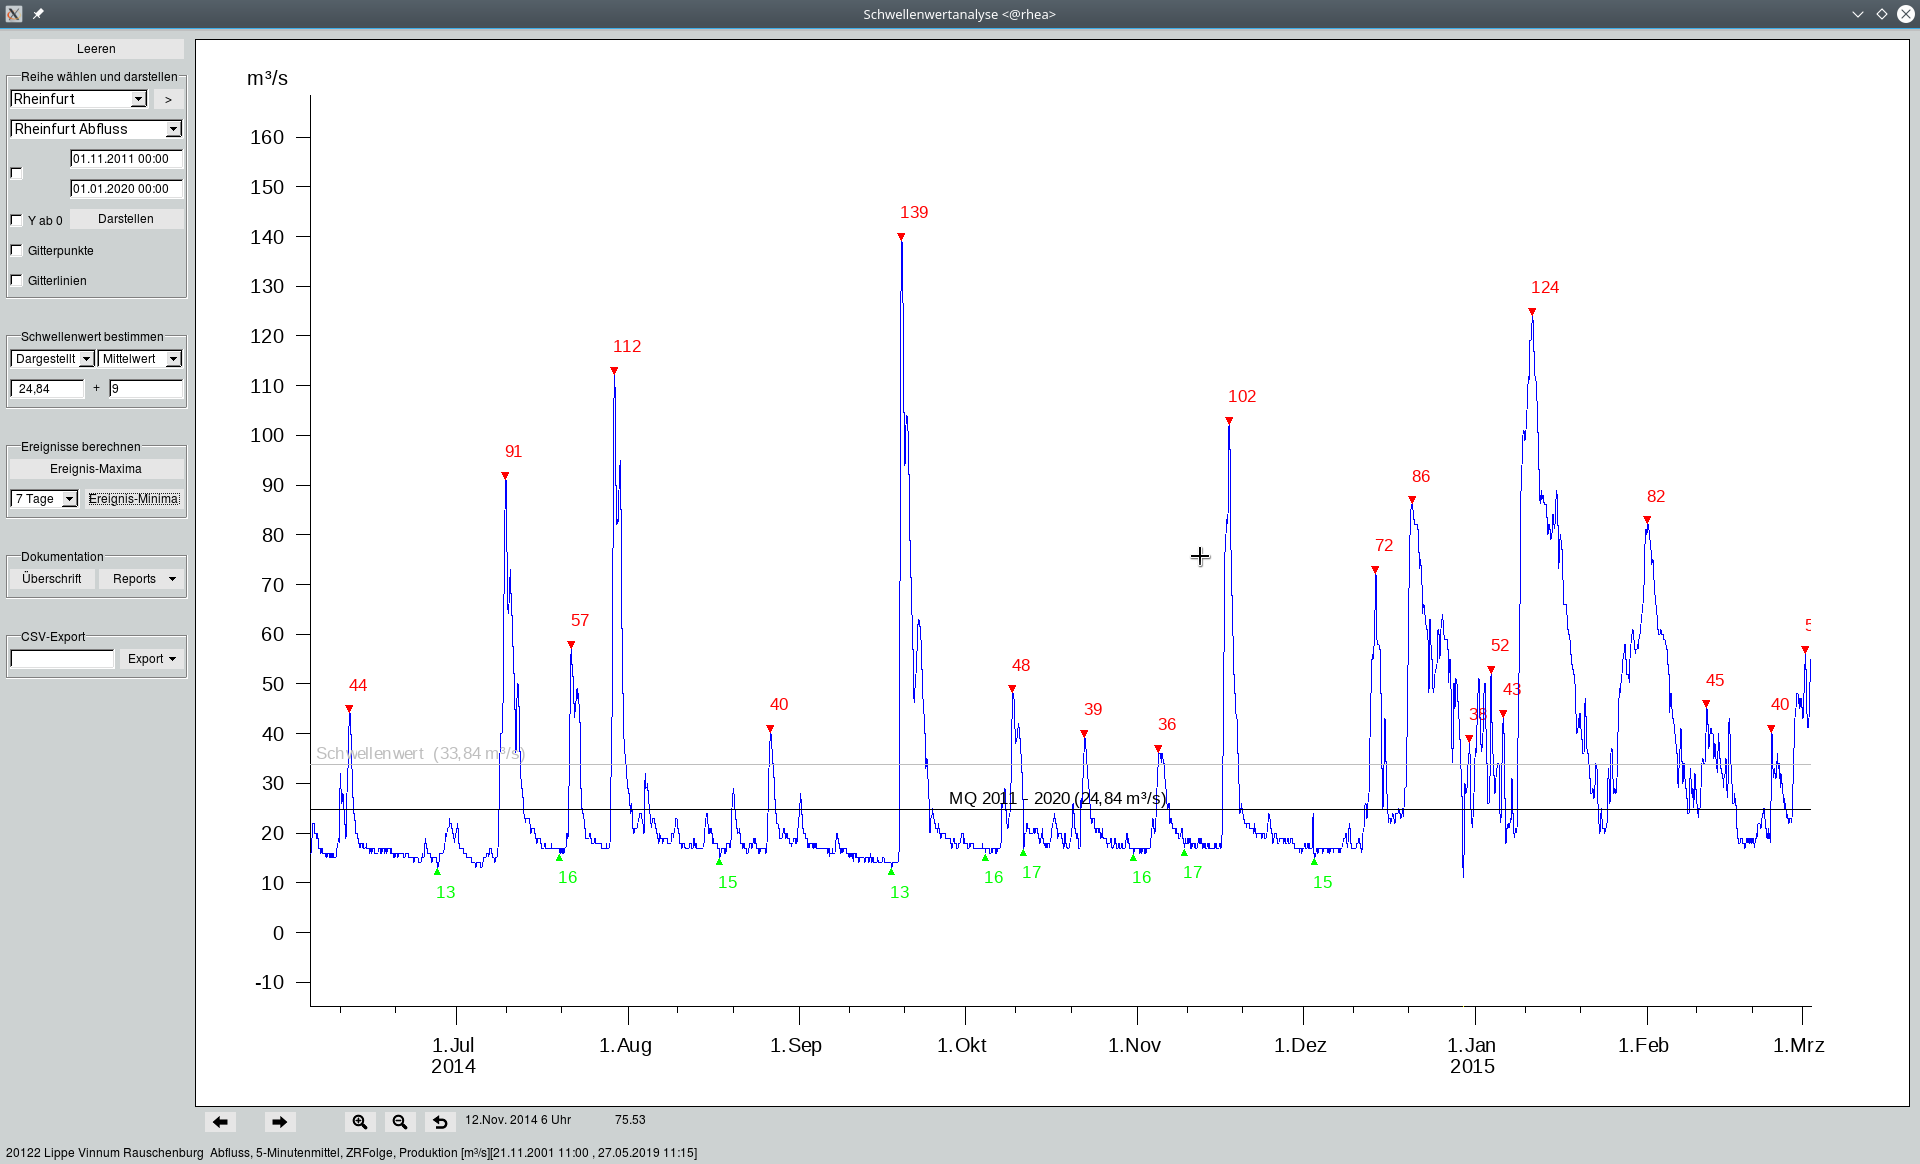
Visualization of hydrographs Continuous time series can be displayed one above the other for stations and parameters that can be combined as desired. All graphics are zoomable and scrollable. In addition, you can edit and print them graphically and in tabular form. The layout can be made interactive. Regularly recurring displays can be saved. This quick view can also be called from numerous sub-functions, and will give you an overview of the output of the current series in seconds.
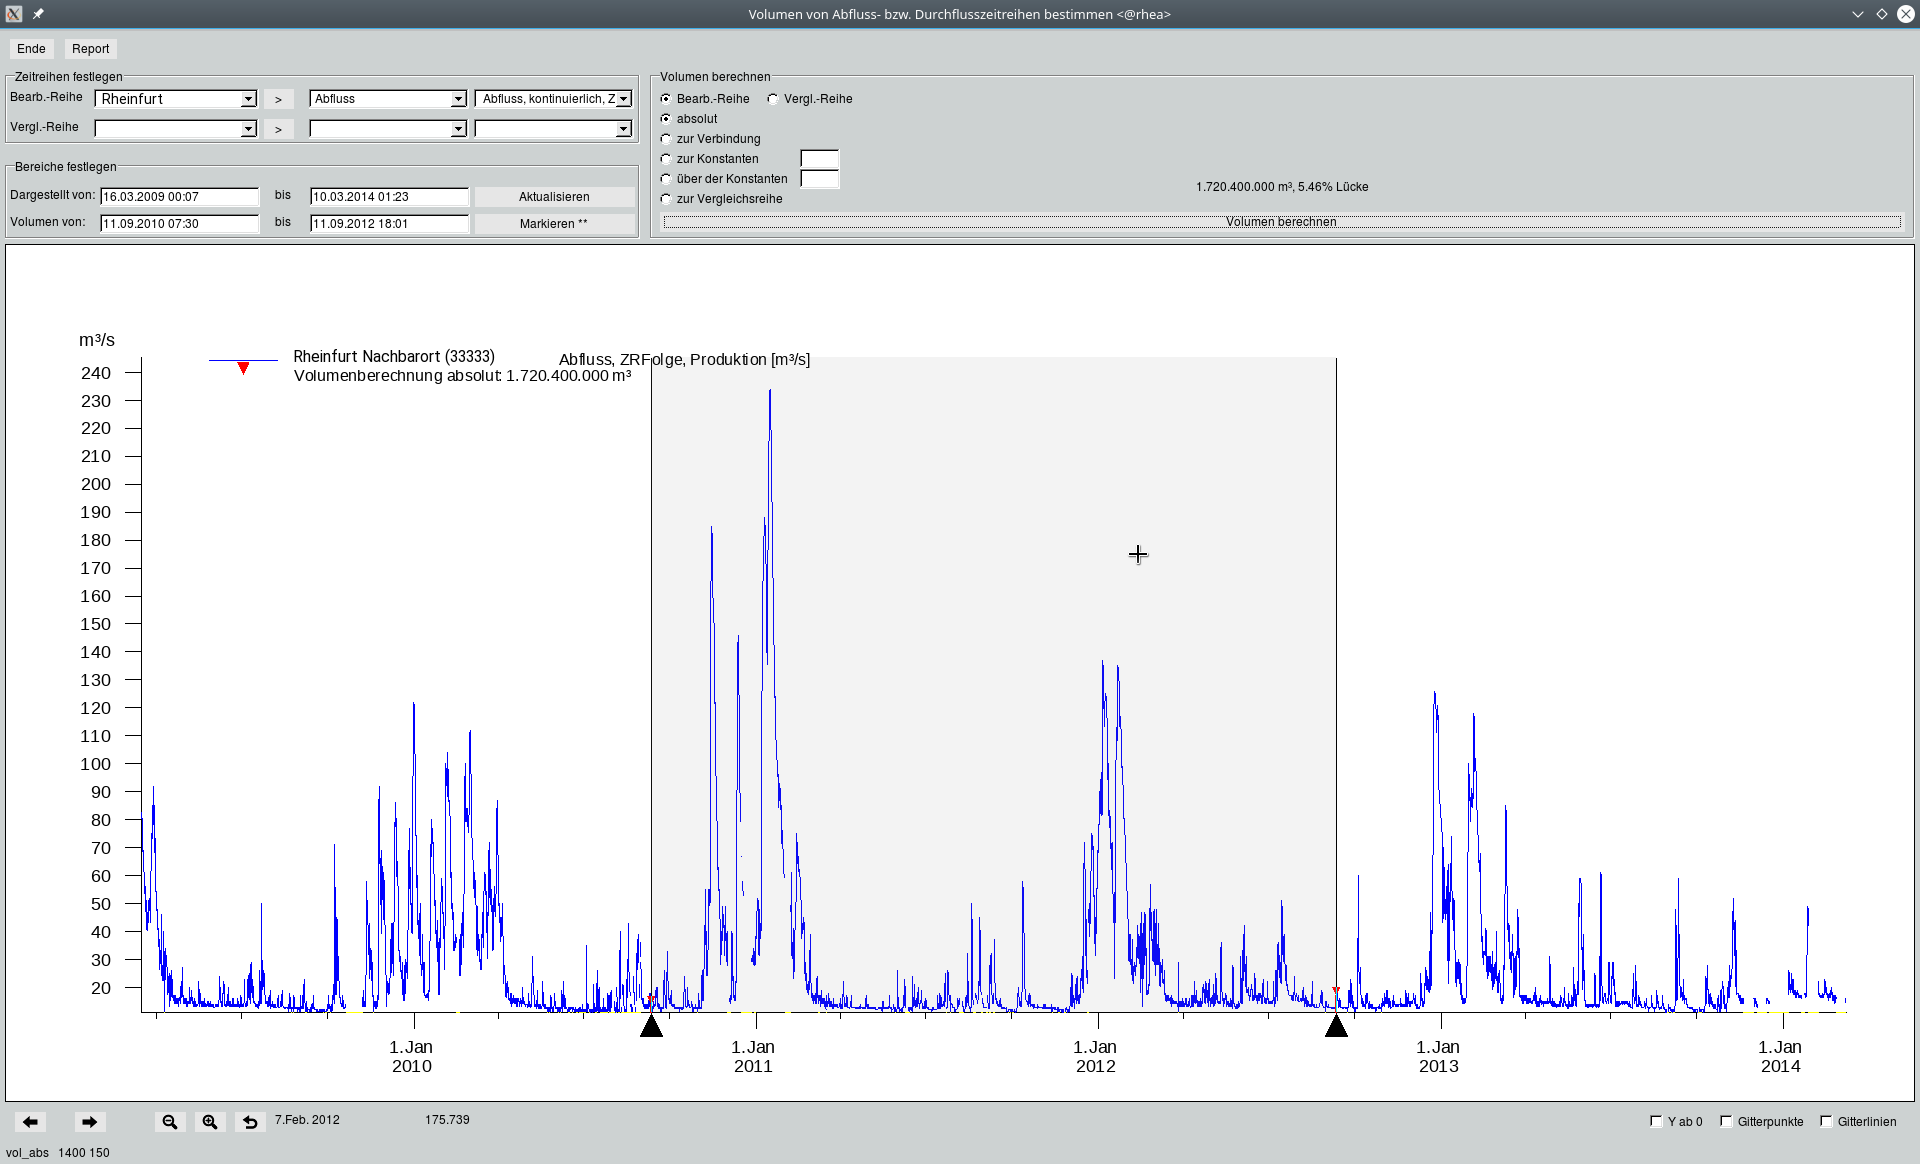
Volume For discharge time series, the discharge volume can be determined in an interactive graphic for any time interval. The volume is absolute, calculable over the combination of the discharge coordinates in a selected time interval, or can calculate the difference from a similar series. This application delivers information very quickly, for example, the volume that has discharged between two gauges with respect to how much has flowed in or out.

 +49 241 92 78 92-0
  post@toposoft.de